Example gallery
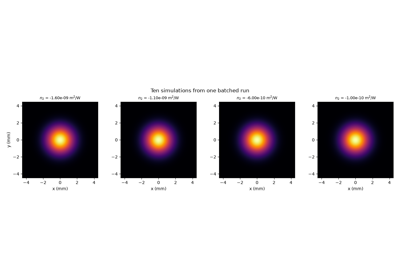
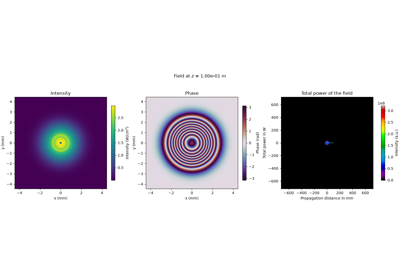
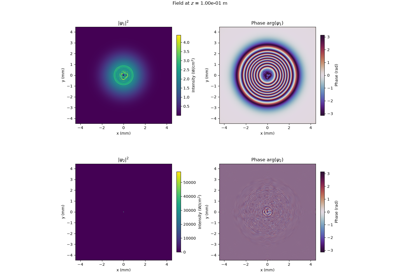
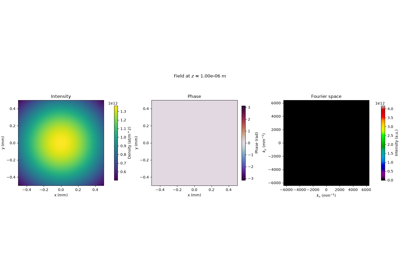
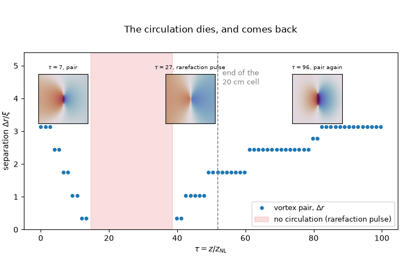
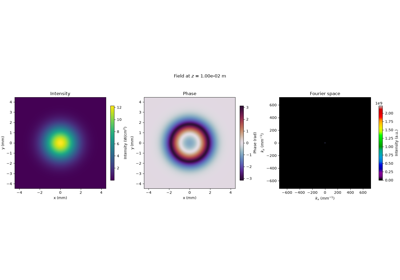
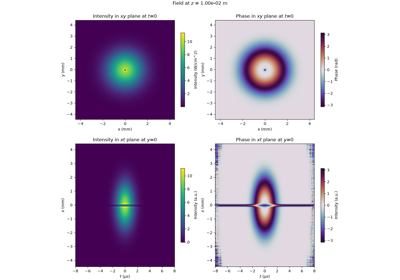
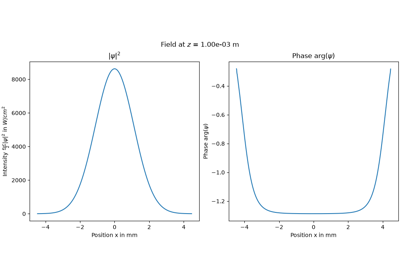
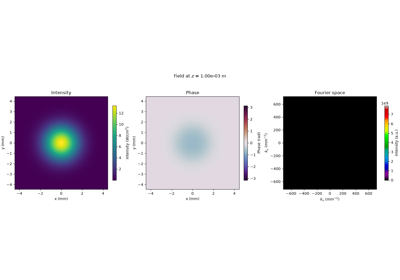
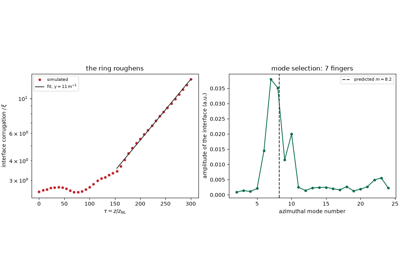
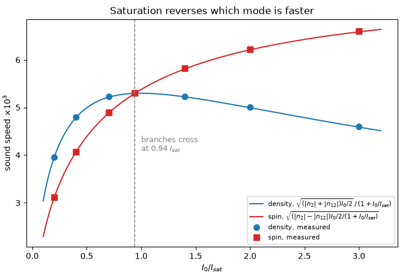
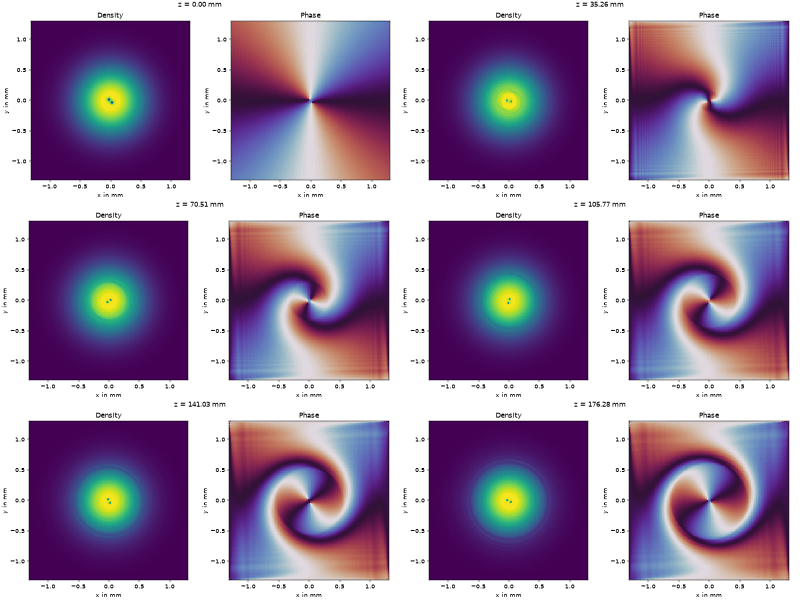
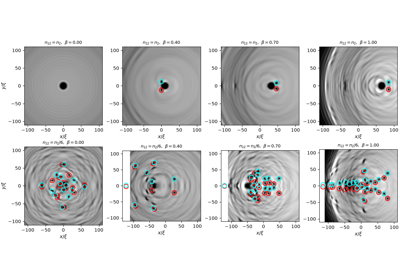
Every script here is run when the documentation is built, and the figures below are the ones it produced. Each page carries the source, so the code you read is the code that made the plot.
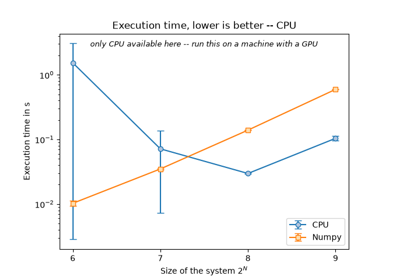
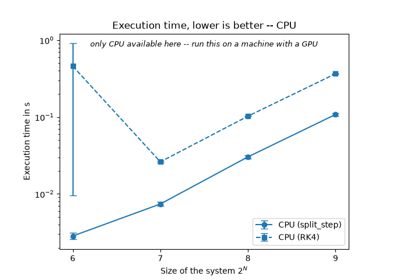
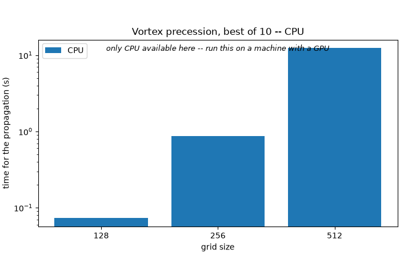
The benchmark sweeps run over a short range of grid sizes here, so the graph below is one this build drew; run them yourself and they cover the full range.
They are also drawn on the machine that built these pages, which is a GitHub runner with no GPU: it has the CPU backend and nothing else, so a comparison between backends has nothing to compare. Run them on your own hardware for that – the figures say which backends they found.
Two are listed with their source but not executed, because both exit early
without what they need: profile_cupy.py wants a CUDA device, and
juliaGPE_vs_NLSE.py wants timings from a benchmark run.